Five new satellite analytics tools for agriculture
Written by Tanel Kobrusepp, product manager
Introduction to KappaZeta's new AI-based Agricultural Solutions
KappaZeta's latest contribution to agricultural technology involves a set of five innovative products based on AI and machine-learning, each uniquely leveraging Sentinel-1 and Sentinel-2 satellite data. These services are designed to address key aspects of agricultural management and analysis, catering to the needs of scientists, government officials, and professionals in farming, farm management and insurance. The suite includes tools for Crop Type Detection, enabling precise identification of various crop types; Parcel Delineation for accurate land mapping; Seedling Emergence Detection to monitor early crop growth; Farmland Damaged Area Delineation for assessing areas affected by adverse events and Ploughing and Harvesting Events Detection to track critical farming activities. These tools collectively aim to enhance agricultural practices through data-driven insights, fostering more informed decision-making in the field of agriculture.
Crop Type Detection
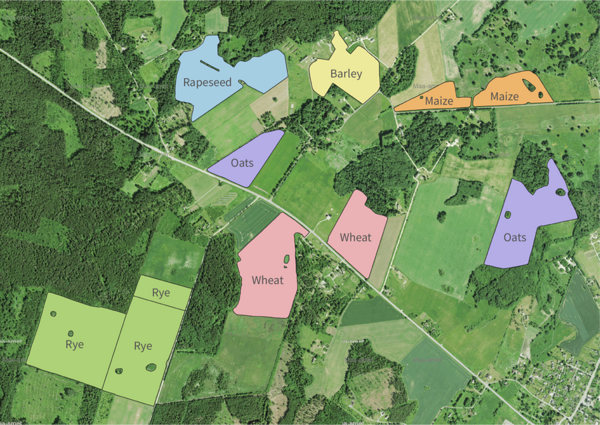
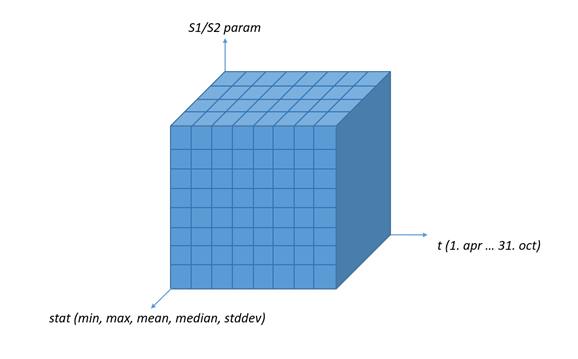
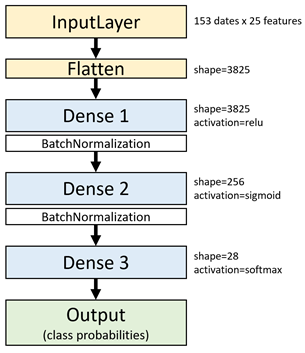
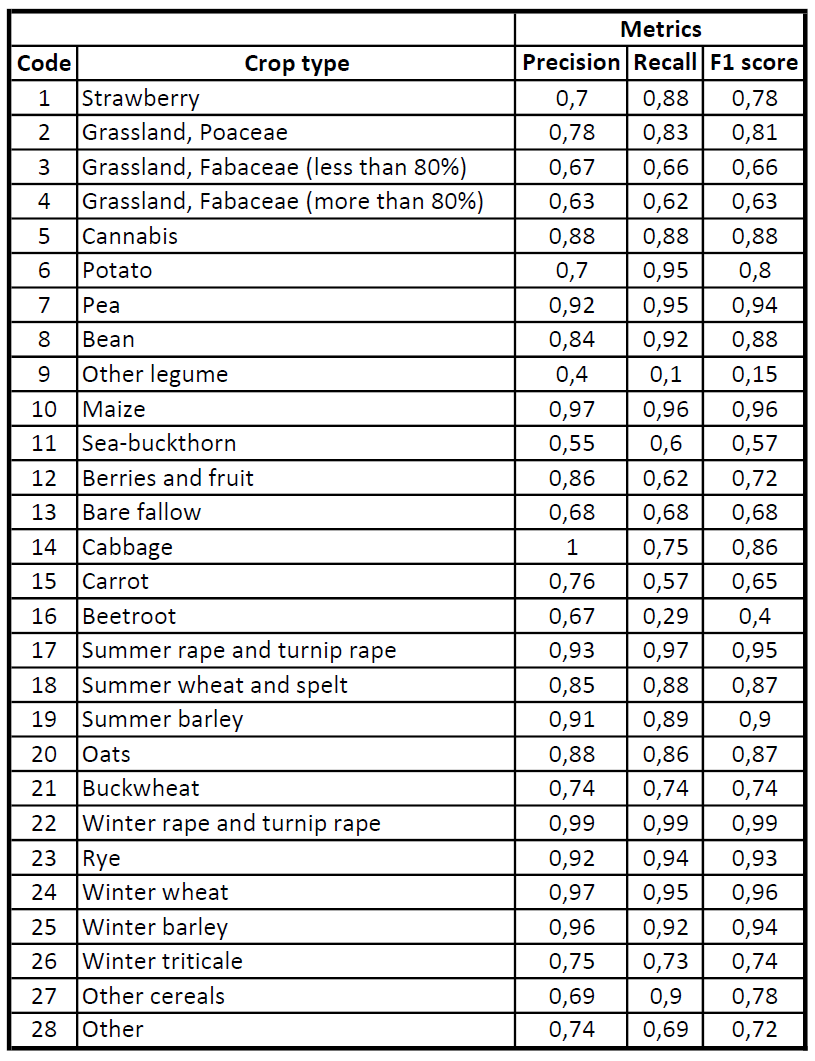
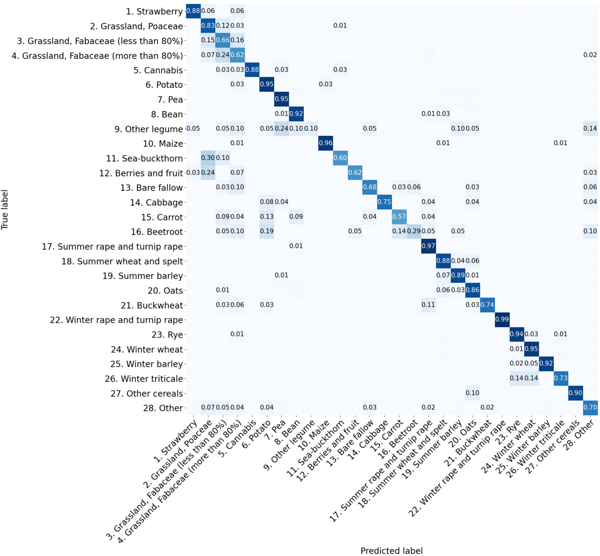
The Crop Type Detection service developed by KappaZeta effectively leverages Sentinel satellite data to accurately identify various crop types across extensive agricultural regions. For crop insurance companies, this tool aids in risk assessment by providing detailed information about the crops insured, allowing for more accurate risk profiling and premium calculation. Government agencies can utilize this data for agricultural policy planning and monitoring, ensuring resources are appropriately allocated. Additionally, the tool assists in environmental monitoring, as understanding crop distribution is key in assessing ecological impacts and land use planning. For the agricultural market at large, this information helps in forecasting supply and demand trends, crucial for market stability and pricing strategies. Thus, the Crop Type Detection service offers practical benefits across multiple facets of the agricultural industry.
Parcel Delineation
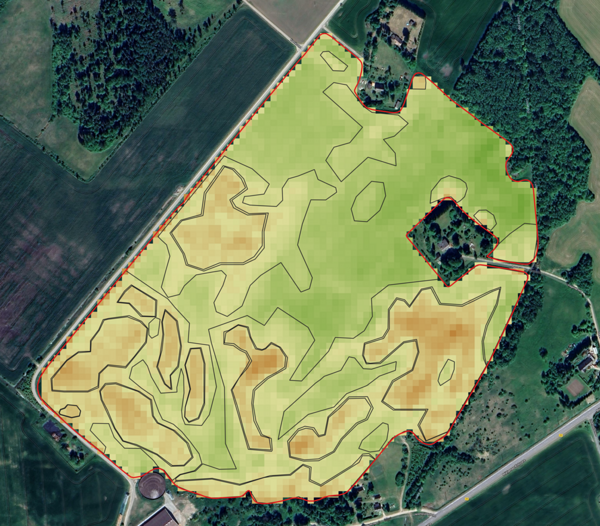
The Parcel Delineation, a part of KappaZeta's array of tools, focuses on the critical task of accurately mapping agricultural land parcels. Utilizing images from Sentinel satellites, the tool provides detailed and precise outlines of farm plots. This product is particularly valuable for Earth observation data analysis companies, as it enhances their ability to develop downstream applications, especially in scenarios where existing parcel boundaries are not readily available. By providing detailed and accurate delineations, the product enables these companies to generate more refined insights into land use, crop health, and environmental monitoring. Government entities benefit from this in land use planning and policy implementation, ensuring fair and efficient allocation of resources and compliance with agricultural regulations. Beyond its operational value, accurate parcel delineation is also a step towards more responsible and sustainable agricultural practices, as it helps in better understanding and managing land resources.
Seedling Emergence Detection
The Seedling Emergence Detection service addresses a critical early stage in the agricultural cycle. This service effectively identifies the emergence of seedlings across various crop types. This early detection capability is invaluable for farmers and agronomists, enabling them to swiftly assess germination success and take timely actions if needed, such as re-sowing or adjusting crop management practices.
By knowing the exact emergence dates, insurance providers can better evaluate the vulnerability of winter crops to early-season adversities such as frost, or pest attacks, leading to more accurate premium calculations, portfolio management and efficient claim management.
For Earth observation companies, this service adds a crucial layer of data, enhancing their ability to provide comprehensive agricultural analyses and insights. In contexts where early growth stages are critical for yield prediction and risk assessment, this tool provides a significant advantage. Furthermore, the Seedling Emergence Detection assists in fine-tuning irrigation and fertilization plans, contributing to more efficient and sustainable farming methods. Its utility extends to research and policy planning, offering data that can inform studies on crop development and agricultural strategies.
Farmland Damage Assessment
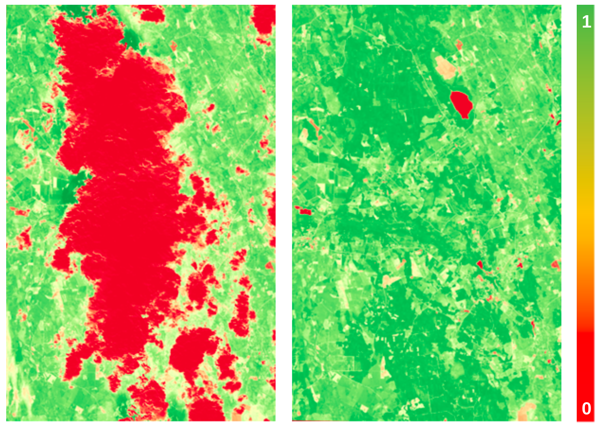
The Farmland Damaged Area Delineation specializes in mapping areas within agricultural lands that have sustained damage by adverse events such as extreme weather, pests, or disease outbreaks. For farmers, this tool is invaluable for quickly pinpointing affected areas, enabling them to implement targeted responses such as reallocating resources, adjusting irrigation, or applying specific treatments to the damaged zones. In the realm of crop insurance, this service provides crucial data for the prompt and accurate processing of claims, offering objective, verifiable evidence of the extent and location of damage, without even going to the field. This service is additionally vital in disaster response and management, assisting government agencies in efficiently directing resources and aid to the most affected regions. Furthermore, the data gathered by this product can contribute to long-term agricultural planning and environmental monitoring, helping to understand patterns of damage and inform future mitigation strategies.
Detecting Ploughing and Harvesting Events
The Ploughing and Harvesting Events’ date Detection service is a critical tool for monitoring key agricultural activities. For crop insurance companies, this information is essential in assessing the timing and methods of farming practices, which are integral factors in risk assessment and claim verification. This tool also plays a significant role in compliance with agricultural policies. Specifically, for government agricultural paying agencies, the detection of ploughing events is mandatory under the CAP2020 policy. The product’s ability to provide accurate and timely data ensures that these agencies can effectively monitor and enforce compliance with agricultural policies. Additionally, cultivation data offers valuable insights into farming patterns and their environmental impacts, assisting in the development of more sustainable farming practices which is a key component of carbon farming project monitoring.
Empowering the Future of Agriculture with AI and Satellite Data
KappaZeta's innovative suite of AI and machine learning-based tools, utilizing Sentinel-1 and Sentinel-2 satellite data, represents a significant advancement in agricultural technology. These tools address key areas of agricultural management and analysis, catering to a diverse range of users including scientists, government officials, and professionals in farming, farm management, and insurance.
Overall, these tools collectively enhance data-driven decision-making in agriculture, leading to more efficient and sustainable practices. They demonstrate the pivotal role of advanced satellite analytics in transforming modern agriculture.
The prototypes for all five services were developed during the project “Satellite monitoring-based services for the insurance sector – CropCop”, supported by the European Regional Development Fund and Enterprise Estonia.

