
The Normalized Difference Vegetation Index (NDVI) is a widely used index for monitoring the health and productivity of vegetation. It is derived from the red and near-infrared (NIR) bands of passive optical sensors, such as satellites like Landsat or Sentinel-2. However, cloud cover and other atmospheric interferences can often obscure optical satellite imagery, making it difficult to accurately measure NDVI. This hinders vegetation monitoring and downstream applications, such as detecting crop damage, yield map synthesis, and others that rely on clear imagery or a sufficiently dense series of NDVI images, given constrained satellite revisit times. Cloud cover is especially problematic in the autumn in Northern Europe, where cover persists for long periods of time.
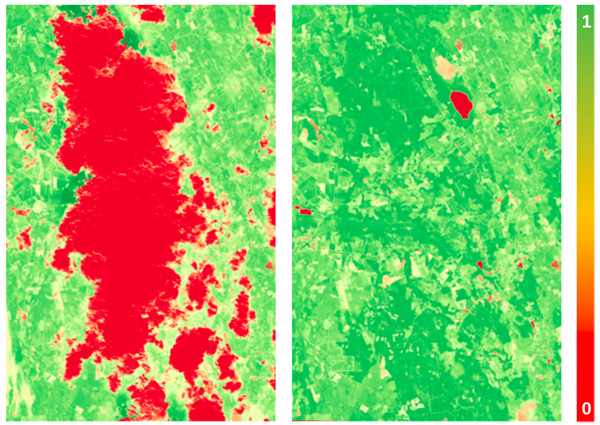
An alternative to using passive optical sensors for vegetation monitoring is radar satellite data, which can penetrate clouds and vegetation, providing a more consistent view of the Earth’s surface. Although differing in their sensing modalities, the backscatter features of Synthetic Aperture Radar (SAR) data are useful for detecting crop cover over agricultural areas whilst the coherence feature has been observed to be inversely correlated to NDVI, making them complementary data sources for interpolating missing NDVI data [1] [2].
Modelling Approach
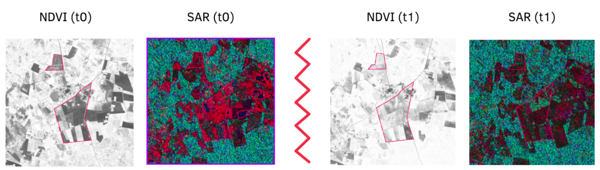
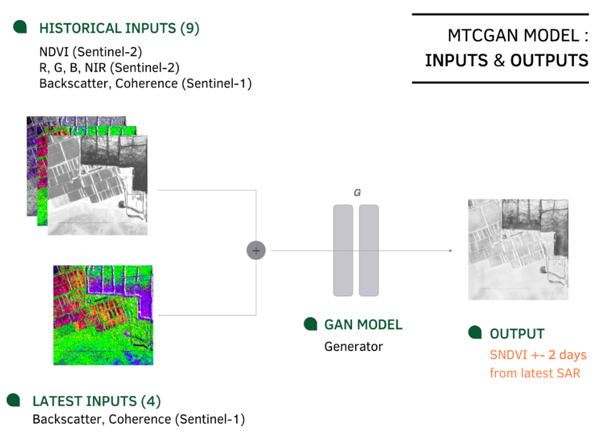
To explore this relation between SAR and NDVI imagery, we rely on a multi-temporal deep generative model (based on pix2pix [3]), to train 512 × 512 px sub-tiles of aligned SAR and optical imagery (as shown in Figure 3), covering mostly agricultural parcels. Each optical input is collocated with a SAR image +- 2 days from each other. For the baseline model (data architecture in Figure 3), model inputs are a recent SAR image +- 2 days from the NDVI image to be synthesized, and historical S1-S2 image sub-tiles (max 30 days from target). A recent variation to this approach, adds recent optical inputs (RGB, NIR, NDVI) to the SAR image, applying our in-house cloud mask (KappaMask) to predict NDVI for occluded areas only. This yields better performance for larger heterogenous areas.
Evaluating Synthetic NDVI Imagery
Full-reference image metrics such as SSIM, PSNR, and MAE are utilized to evaluate the accuracy of synthesized images, at the sub-tile level, with results in Table 1.
| Sub-tiles | MAE | SSIM | MS-SSIM | PSNR |
| 2547 | 0.05 | 0.88 | 0.93 | 24.88 |
However, owing to the parcel heterogeneity in a single sub-tile, more efforts were placed on evaluating predictions at the parcel-level. These measures include evaluating absolute NDVI changes (MAE), the correlation between real and predicted NDVI changes (pixel histogram correlation) and exploring subfield variance classes. For vegetation monitoring, NDVI is useful for monitoring crop phenology, and we began exploring this use-case with a broad categorization of observed changes w.r.t NDVI increase (crop growth) or decrease (crop decline/maturity).
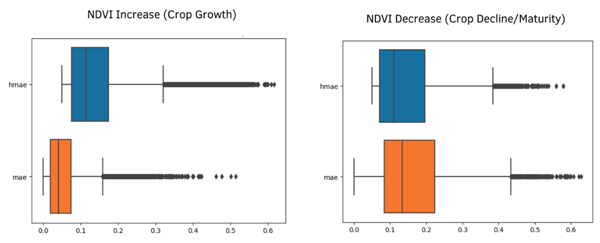
Figure 4 describes the overall change in NDVI (between historical and target NDVI), compared with the MAE prediction error between SNDVI and target NDVI for observed parcels. In summary, NDVI synthesis is more accurate for crop growth events, and less accurate for crop decline and the sudden changes (including, plowing, harvesting) that influences these events.

Conclusion, limitations and future work
In this article, we introduced a generative approach to synthesize NDVI images from multi-temporal SAR and historical optical data. We highlighted some evaluation metrics and demonstrated that our MTCGAN model is more effective at predicting NDVI increases compared to negative changes. Another point worth highlighting is that the performance (MAE) does not degrade significantly by using older historical S2 inputs (within the 30-day limit).
However, the results shared here are for 6-day coherence SAR inputs. Performance worsens for the current Sentinel-1 alternative (12-day coherence, due to Sentinel 1B malfunction), moreso for predicting crop decline. For crop decline, a factor is the contrast between interferometric coherence in historical and target SAR images. After a crop removal event, at least 2 SAR images are required for the coherence to reflect the change, compared to crop growth with less drastic changes in coherence. Accounting for this SAR limitation will be key in improving results for this case.
To further understand the usefulness of synthesized NDVI images, we plan to examine their ability to indicate specific crop phenological stages. This will help us understand the limitations and potential applications of these images for individual crop monitoring. We intend to expand our prediction of NDVI increase/decrease to include more specific stages such as crop emergence, flowering, crop maturity, and senescence, and we will test this on different types of crops.
Lastly, another useful application for monitoring agencies and/or farmers may be zoning or detecting fields and subfields which demonstrate homogenous or heterogenous growth. Initial analyses of SNDVI images show F1-score accuracies of 71% for classifying low NDVI variance parcels and 42% for high variance classes. Continuing work will evaluate crop-specific cases before concluding analyses.
For some examples of AI-generated images, visit our SNDVI demo map here. In addition to SNDVI created for 6-days coherence, we will be adding other images created from 12-days coherence, and in the future, other AI-derived vegetation indices for crop monitoring.
Acronyms
Synthetic Aperture Radar (SAR), Normalized Difference Vegetation Index (NDVI), Generative Adversarial Network (GAN), Conditional GAN (CGAN), Multi-Temporal CGAN (MTCGAN), Synthetic NDVI (SNDVI), Historical NDVI (HNDVI), Mean Absolute Error (MAE), Historical MAE (HMAE), Structure Similarity Index (SSIM), Peak Signal-to-Noise Ratio (PSNR)
References
[1] Voormansik, K. et al. (2020) “Separability of mowing and ploughing events on short temporal baseline sentinel-1 coherence time series,” Remote Sensing, 12(22), p. 3784. Available at: https://doi.org/10.3390/rs12223784.
[2] Harfenmeister, K., Spengler, D. and Weltzien, C. (2019) “Analyzing temporal and spatial characteristics of crop parameters using sentinel-1 backscatter data,” Remote Sensing, 11(13), p. 1569. Available at: https://doi.org/10.3390/rs11131569.
[3] Isola, P. et al. (2017) “Image-to-image translation with conditional adversarial networks,” 2017 IEEE Conference on Computer Vision and Pattern Recognition (CVPR) [Preprint]. Available at: https://doi.org/10.1109/cvpr.2017.632.