Data splitting challenge

Almost any machine learning pipeline requires an input data split for training and validation purposes. However, ground truth collection is challenging and could be gathered from different sources. Various sources provide different confidence levels for the labels and in general it would be beneficial to test the model on the most confident samples, but also providing some part of it for training as well, keeping the class distributions as uniform as possible. We are facing the challenge of having unbiased data split with adjustable filters in different tasks and it feels that there is a need for a more general solution or brainstorming from the community.

Mowing detection

One of the examples where we meet the splitting challenge is the mowing detection task. The goal of mowing detection is to predict the time at which the grass on the field was cut. Thus, as part of our mowing detection project, each year we collect field books from farmers and field reports from the inspectors of the local paying agency. The received data is converted and reviewed manually, and some of the ground truth is produced from the manual labelling.

The labels would differ in trustworthiness, depending on the source (farmer field books, inspector field reports, any of the former with manually adjusted dates, or fully manual labelling). Since inspector field reports are the most reliable source, we would use most of them for the validation and test set. However, we would need at least some of them to be present in the training dataset as well. Additionally, each dataset is expected to have as well balanced classes distribution as possible, perhaps with additional filtering to randomly drop least trustworthy samples from the over-represented class.

Considering the aforementioned conditions, let’s say we would like to have 70% of the labelled data for training, 20% for validation and 10% for testing. For validation and testing, we would only use instances from inspector field reports and farmer field books with tweaked dates. For training, we would use data from all sources, including the ones from inspector field reports and tweaked field books which were left over from the test and validation datasets.

Crop classification

Another task we are dealing with is crop classification. We would like to detect the crop type of agricultural fields out of 28 possible classes. Similarly to the mowing detection we have different sources for labels, some of which have been provided by the local Agricultural Registers and Information Board, some from drone observations. For crop classification, class balance distribution plays the core role. In order to mitigate the issue of an unbalanced dataset, undersampling and oversampling can be used. Undersampling and oversampling should be available for the training subset, while for testing we would use some of the fields with labels of high confidence. Some of the classes might have a poor representation, due to which general split ratios might leave the validation or test dataset without any samples, whereas we need to ensure that all datasets have enough samples.

Image credit: Madis Ajaots

Thus, the requirements for splitting are the following. We would like to have 70% / 20% / 10% splits, ensuring that for smaller representing classes at least one instance is present in all sets. Additionally for the test set we would like to have the list of high confidence instances together with random leftover samples that added up to 10% of the whole data.

Generic and configurable

While such processing chains can be implemented, we have found it tricky to have it generic and configurable enough to cater for all sorts of projects with different (and sometimes rapidly changing) requirements.

Current solution

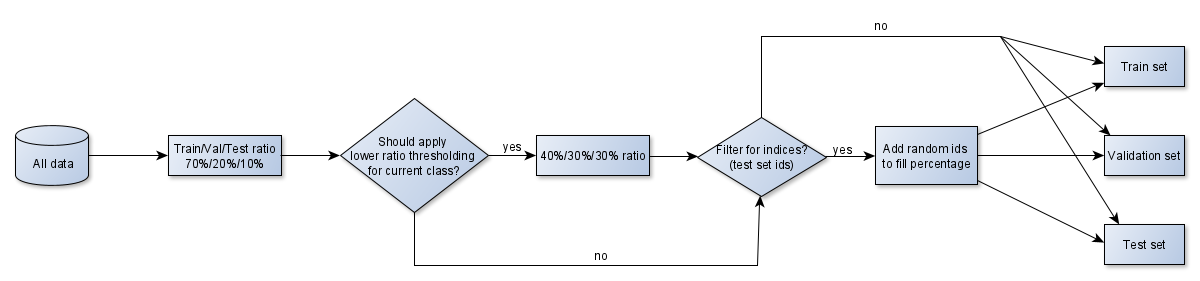
Currently we have separate implementations for mowing detection and crop classification, both of which take input parameters from a config file. The config file is basically python code and supports the definition of custom filter functions for datasets. For each dataset, the current solution invokes custom filters (if any) and then performs random sampling of data indices, leaving the rest of the samples for the next datasets. The samples which have been filtered out, are also left for the next datasets, for each dataset might have a different filter.

The reason why we prefer to use data / sample indices instead of data directly, is to have a layer of abstraction. This way the splitting logic could be agnostic of data type. It would not matter whether a single sample / instance is a raster image, an image time-series or time-series of parameter values which have been averaged over a pre-defined geometry.

For multiclass applications such as crop classification, data indices are sampled separately for each class within each dataset. The splitting also supports capping of samples for classes which are represented too well. However, if there are too few samples per class, a low threshold can be applied such that a different split ratio would be used. For instance, in the case of 70% training, 20% validation and 10% testing dataset with just 9 samples in one of the classes, we might end up with 7 samples in the training dataset, 2 samples in validation and 0 in the test set. To mitigate the issue, we could have the ratios adjusted to 40% training, 30% validation and 30% testing for classes with less than 100 samples.


Ideas for future developments

Instead of project-specific implementation of the splitting logic, we would prefer to have a generic framework for graph-based data splitting with support for cross-validation and bagging. Please let us know if there is such a framework already out there, or if there would be community interest in developing the framework.

Read more

Towards the operational service of crop classification

We are about to finish a R&D project, where we developed and tested crop classification methodology specifically suited for Estonian agricultural, ecological and climatic conditions. We relied mostly on Sentinel-1 and -2 data and used neural network machine learning approach to distinguish 28 different crop types. Results are promising and the methodology is ready for operational service to automate another part of agricultural monitoring.

Using machine learning in crop type classification is not new, and definitely not a revolutionary breakthrough - already for decades different classifiers (Support Vector Machine, Decision Trees, Random Forest and many more) have been used in land cover classification. Recently also neural networks, the wunderkind of machine learning and image recognition, are widely used in crop discrimination. Satellite data, as the main input to classification models, has no serious alternatives, since our aim is to implement it on worldwide scale and in applications, which run near real time. So, why even get excited about another crop type classification study, which exploits same methods and datasets as tens of previous studies?

I can give you one reason. Estonia has been very successful in following European Commission (EC) guidelines and rules in modernizing the EU Common Agricultural Policy. In 2018 EC adopted new rules that allow to completely replace physical checks on farms with a system of automated checks based on analysis of Earth observation data. The same year Estonian Agricultural Registers And Information Board (ARIB) launched the first nation-wide fully automated mowing detection system, which uses Sentinel-1 and Sentinel-2 data and where the prediction model inside the system is developed by KappaZeta. The system has been running for 3 years, it has significantly reduced the amount of on-site checks and increased the detection of non-compliances. In short – saved Estonian and EU taxpayers’ money. Automated crop discrimination is the next step in pursuing the above-mentioned vision and will probably become the foundation of all agricultural monitoring. With proved and tested methodology, it’s highly likely that Estonia will take this next step in the very near future and launch it again on the nationwide level. This is definitely a perspective to be excited about.

Now, let’s see how we tackled “the good old” crop classification task.

Input data

Although algorithms and methods are important to make a difference in prediction model performance, the training data is the most valuable player in this game. In Estonia all farmers who want to be eligible for subsidies need to declare crops online (field geometry + crop type label). This open dataset is freely accessible to everyone and has the permission to re-use and redistribute both commercial and non-commercial purposes. Since the crop type labels are defined by farmers and most of them are not double-checked by ARIB, there can be mistakes (according to ARIB’s estimations, less than 5%). Therefore, for additional validation we ran our own cluster analysis on time-series to filter out obvious outliers in each class.

After we had the parcels and labels, we calculated time-series of different satellite-based, plus some ground-based features (precipitation, average temperatures, soil type). When extracting features from satellite images there are two ways to go: pixel- or parcel-based extraction. We selected the latter and averaged pixel values over the parcel to obtain one numerical feature value per statistic for each point in time (see Figure 1).
Figure 1. An example time-series of one Sentinel-1 feature (cohvh - 6-day coherence in the VH polarization) for one parcel.

For Sentinel-1 images preprocessing we have developed our own processing chain to produce reliable time-series for several features. From the previous studies it’s known that features (channel values and indexes) from Sentinel-2 images combined with features from Sentinel-1 images (coherence, backscatter) give better classification results than any of these features separately.

Figure 2. The whole dataset can be imagined as a three-dimensional tensor with the feature parameters on one axis, parameter statistics on another, and date-time on the third axis.

We used data from 2018 and 2019 seasons (altogether more than 200 000 parcels) and aggregated all crop type labels into 28 classes which were defined by the need of the ARIB.

Model architecture

Figure 3. Model architecture.
Due to the very unbalanced dataset we had to under-sample some classes and over-sample others for the training data. In small classes we used the existing time-series and added noise for data augmentation.

Model architecture was rather simple – input layer, flatten layer, three fully connected dense layers (two of them followed by batch normalization layer) and output (Figure 3). Our experiment with adding 1D CNN layer after input didn’t improve results significantly. More complicated ResNet (residual neural network) architecture increased training time by approx. 30%, but results were similar to a linear neural network.


Classification results

F1 score on validation set (9% of all dataset) was 0.85 and on test set (2% of all dataset) 0.84. In 10 classes the recall was more than 0.9 and in 16 classes more than 0.8. See more from Figure 4 and 5. 
Figure 4. Test set results.
Figure 5. Normalized confusion matrix of the crop classification results (recall values).

Some features are more important than others

In a near-real time operative system our model and feature extraction would have to be as efficient as possible. For an R&D project we could easily calculate 20+ features from satellite images, feed them all to the model and let the machines compute. But what if not all features are equally important?

They are not. We found that the 5 most important features are Sentinel-1 backscatter (s1_s0vh, s1_s0vv), NDVI, TC Vegetation and PSRI from Sentinel-2. To our surprise, soil type and precipitation sum before satellite image acquisition had low relevance.

The 5 most important features played different role during the season – Sentinel-2 features were more important in the beginning and in the end of the season, while Sentinel-1 features had more effect during mid-season.
Figure 6. Importance of different features in crop classification, estimated using Random Forest.

What next?

This project was part of a much larger initiative called “National Program for Addressing Socio-Economic Challenges through R&D. Using remote sensing data in favor of the public sector services.” Several research groups all over Estonia worked on prototypes to use remote sensing in fields like detecting forest fire hazard, mapping floods and monitoring urban construction. Now its up to Estonia’s public sector institutions to take the initiative and turn prototypes into operational services. With this work we have proved, that satellite-based crop classification in Estonia is possible, accurate enough and ready to be implemented as the next monitoring service for ARIB.

If you are more interested about this study, our Sentinel-1 processing pipeline or machine learning expertise, then feel free to get in touch. We have the mentality to share not hide our experience and learn together on this exciting journey.

Read more