
Satellite data is still not widely used, because it can be complex to acquire and work with. However, the Copernicus Earth Observation programme is a great way to look at our planet and its environment, as it provides continuous radar and optical imagery with its Sentinel satellite missions (currently 1, 2, 3, 5p and 6).
Still, especially Sentinel-1 radar data is used by relatively small user segments, including university research groups and some specific GIS/EO applications. For example, Estonian Environment Agency has recently started to use Sentinel-1 data for complementing ice map for both Baltic Sea and larger Estonian lakes, https://jaakaart.envir.ee/.
The Sentinel-1 data is different than most other satellite data because it is not dependent on weather or daylight, and thus is able to provide data on days where other satellites cannot because of clouds.
As Sentinel-1 is a great data source acquiring large quantitites of Synthetic Aperture Radar data with global coverage, which is valuable for numerous Earth Observation applications, we have decided to make it accessible and easy to use for a wider audience.
There are some services on the market, which make optical satellite data, like Sentinel-2 or Landsat easy to use and analyse. However, there is no application that utilizes the Sentinel-1 data in its full potential. Therefore, KappaZeta team decided to resolve this issue by establishing the KappaOne service, where S1 data will be processed and prepared for the user in analysis ready data (ARD) format.
What is KappaOne?
KappaOne stands for one-click or one API command integration. There are six Sentinel-1 ARD products available, which are presented in human-friendly as well as machine-readable form, providing value for a long list of end-user applications.
Provided Sentinel-1 ARD layers are the following:
- Time series of small geographical region – parcel, statistics (mean, median, min, max, stddev) of Vertical-Horizontal (VH) and Vertical-Vertical (VV) backscatter, VH/VV backscatter ratio, VH and VV 6-day repeat pass coherence (phase difference changes);
- Calibrated high-resolution VH and VV repeat pass interferometric coherence rasters;
- Calibrated high-resolution VH and VV backscatter and VH/VV ratio rasters;
- Multi-polarisation backscatter image for visual use as a WMS service;
- Synthetic Sentinel-2-like natural colours image based on Sentinel-1 and -2 time series with AI-modelling;
- Synthetic NDVI-like raster based on Sentinel-1 and -2 time series with AI-modelling.
You can have an overview of our service here. This is a web-map, where you can choose the layer which you are interested in. Moreover, you can scroll the dates in the calendar to see how the area of interest looked in a particular time.
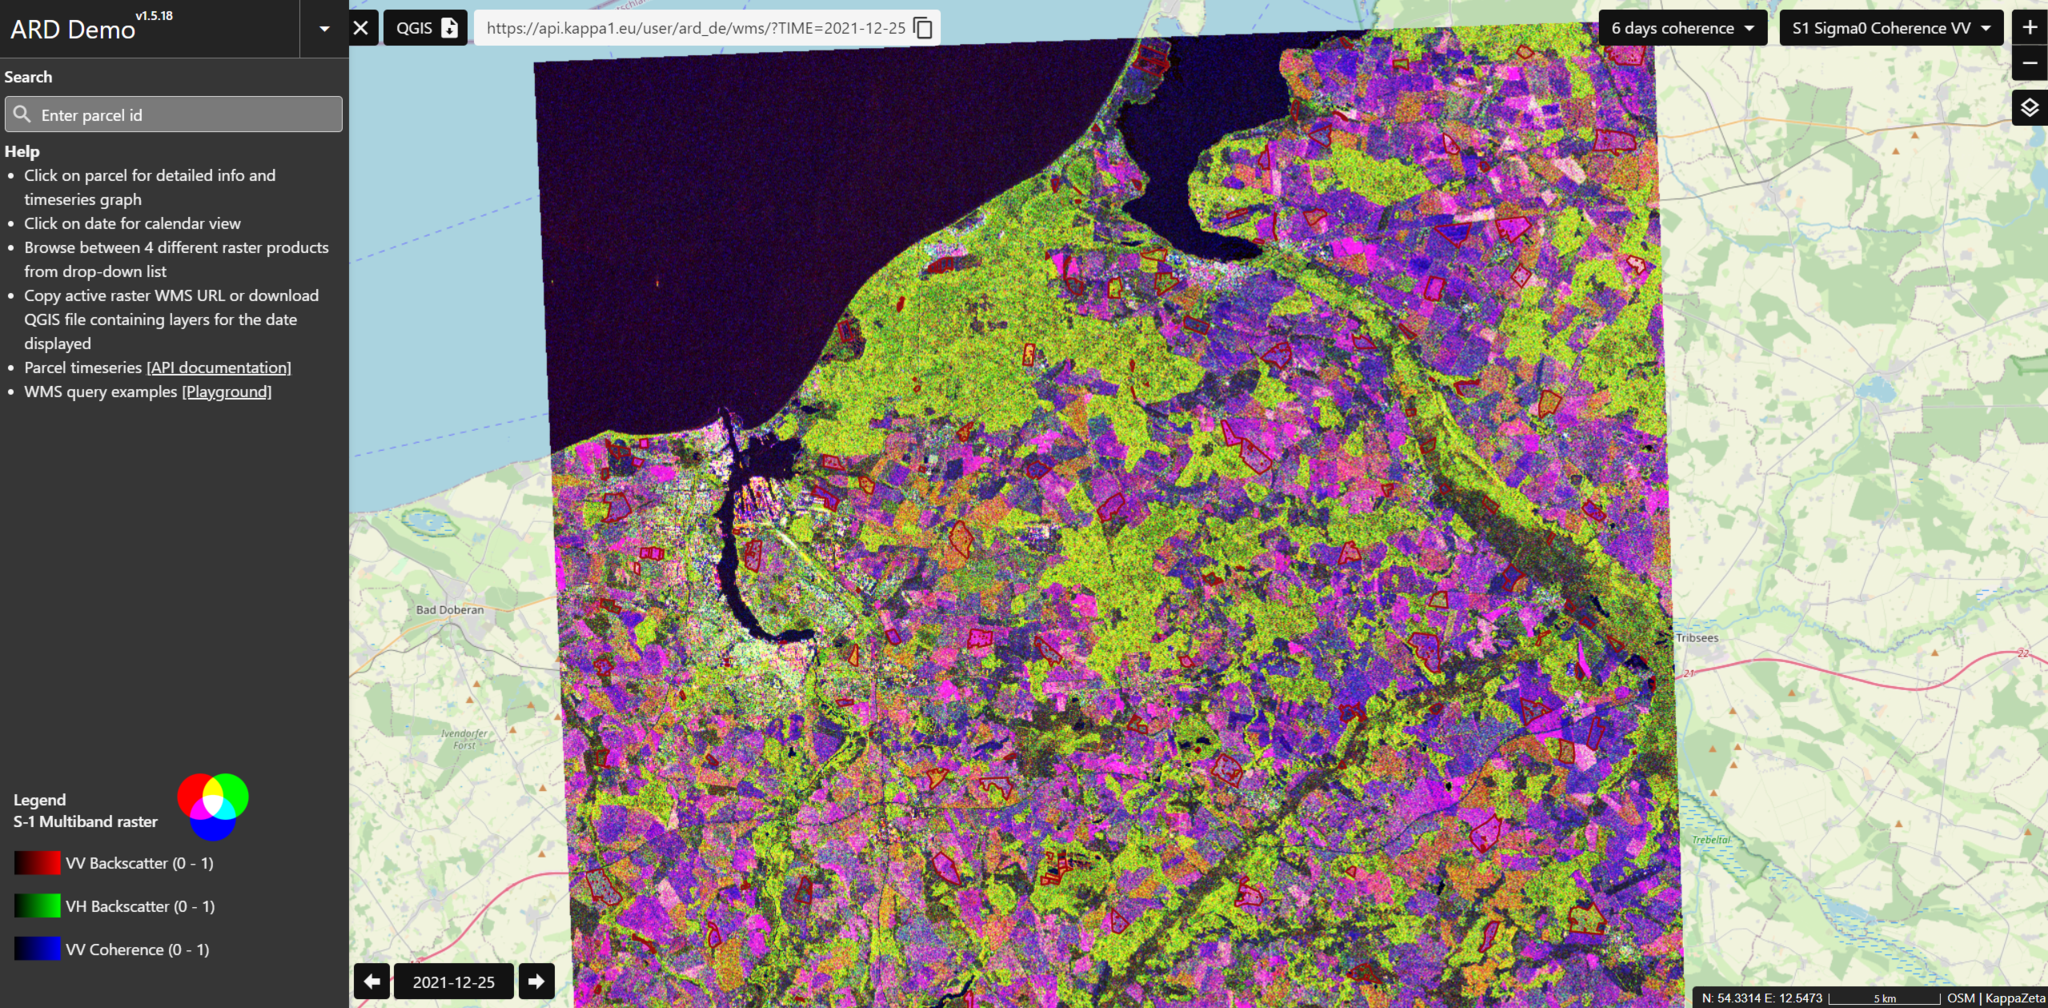
The other convenient feature of our webpage is the one-click command with which you can download a pre-set QGIS project for the layer and date you are interested in. You can open the setup file in QGIS, where you will see the WMS layer with the chosen product for a particular date.
Another asset of the KappaOne service, is a visualisation of the time series of parcel-level statistics. By clicking on the parcel of interest, the chart of the area becomes visible, where you can browse the time series of various Sentinel-1 and Sentinel-2 parameters.
Who can use it and where?
There are numerous applications where Sentinel-1 Analysis Ready Data could be used. For example, this service can be used by the EO or GIS companies without Synthetic Aperture Radar expertise for Mapping/GIS analysis tasks, where frequent and systematic data is needed.
Sentinel-1 ARD is vital also for the agricultural subsidy checks, where on-spot checks conducted by the inspectors are gradually replaced by satellite monitoring. The grassland maintenance checks can be very slow and expensive if done manually. Therefore, for this kind of task, the usage of satellite monitoring is a great way of saving time and money.
With Sentinel-1 data many more tasks can be solved. As it was underlined before, satellite monitoring is an efficient tool for resolving various measurement and assessment tasks, where instead of gut feeling decisions could be done based on actual data. It can be used for the greenhouse gas fluxes modelling, as well as flood risk assessments or the landscape dynamics based on historical data and damage mapping near real time. Also, the monitoring of the seaports could be performed, which would reflect the flow of the sea containers.
The Figure below shows Sentinel-1 multiband image for the port area in Rostock, Germany. Yellow areas on the image represent big metallic constructions, which are the sea containers transported with ships. It is visible that on 29th of May 2021, the ship was leaving or entering the port and ships had changed their location in Rostock port and its surrounding in the sea by 4th of June.
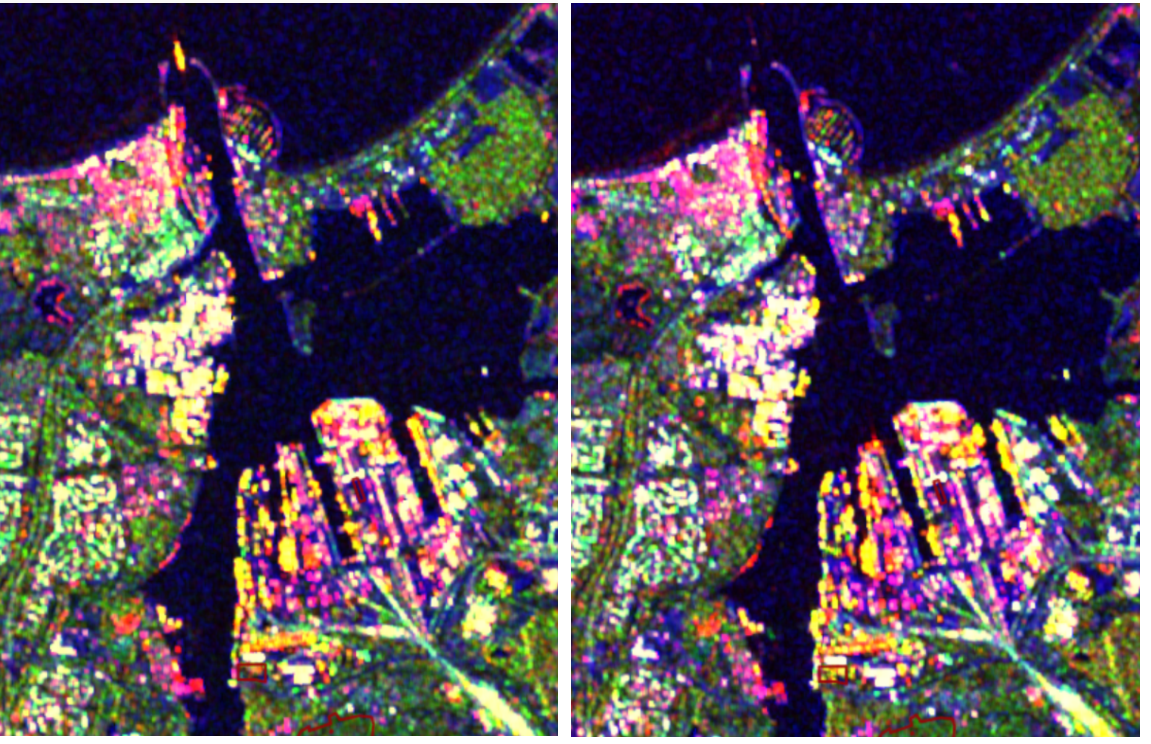
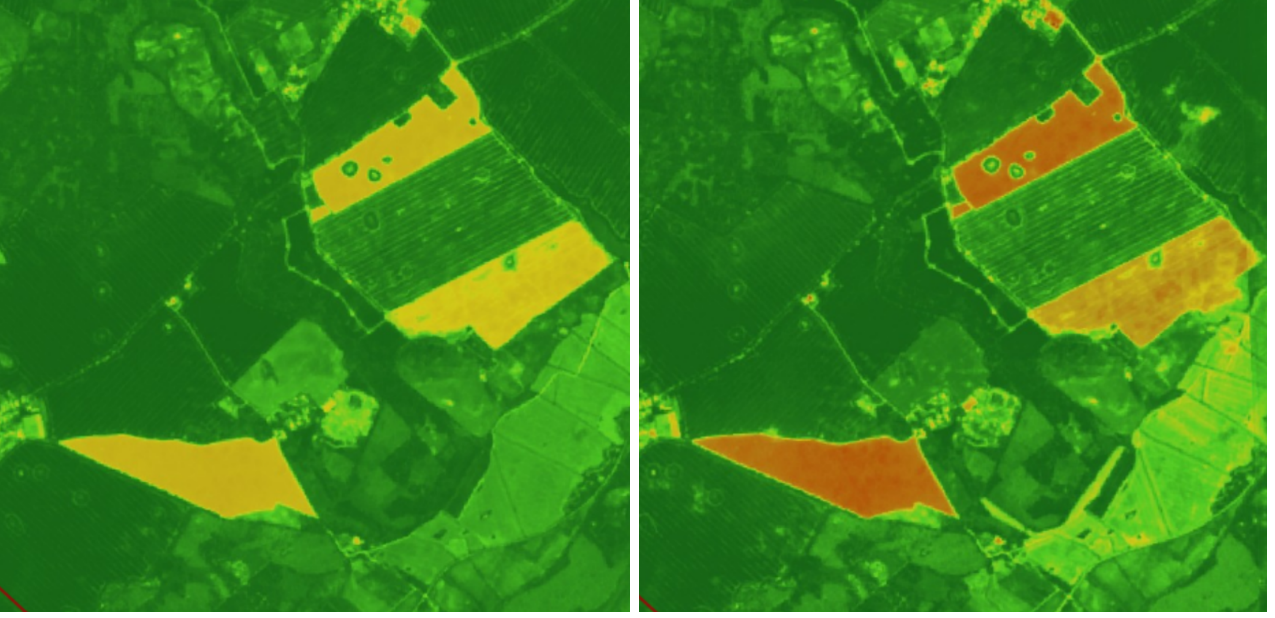
Figure 4 illustrates the ploughing example on the Synthetic NDVI layer, which is computed from Sentinel-1 raster with usage of historical Sentinel-2 data. It is visible that the vegetation index before ploughing on the parcels is significantly higher than after ploughing, as the color changes rapidly from yellow to dark orange.
Olga Wold
Geospatial data quality specialist