
Machine learning intern Karl Hendrik Tamkivi shares insights from his deep dive into the realm of SNDVI.
Modern agriculture is increasingly merging with technological advancements, especially in the area of remote sensing. With climate conditions becoming more unpredictable, there is a clear need for resilient agricultural monitoring systems. Manual checks of crop damages or specific agricultural activities can be tedious and inefficient, prompting both farmers and crop insurance companies to lean towards automated detection systems. This not only aids in identifying crop failures early but also assists in tracking different growth stages. At the same time, agricultural paying agencies are looking for automated ways to monitor field activities, such as ploughing and harvesting, in order to increase the cost-effectiveness of their work. A promising solution to these varied needs is the development of synthetic vegetation indices, notably the synthetic NDVI (Normalized Difference Vegetation Index).
Crafting reliable generative deep learning models comes with its challenges. One key challenge is integrating SAR (Synthetic Aperture Radar) and optical (RGB and NIR) remote sensing data, especially from satellites like Sentinel-1 and Sentinel-2 of the European Union and the European Space Agency (ESA). While this data is freely available, using it effectively requires precise methodologies. The performance of these GAN (Generative Adversarial Network) models largely depends on the right feature selection. For SAR, the choice between 6-day and 12-day temporal baselines for interferometric coherence is crucial. Here, KappaZeta’s expertise comes into play, making the complex task of processing SAR data much more manageable. Historically, KappaZeta has developed models for both coherence durations. The 6-day models have shown good results in capturing swift changes in crop growth, especially for non-cereal crops, while the 12-day models were better suited for predicting events like crop decline as the season ends.
The existing set of generative models would have been sufficient enough if Sentinel-1B would not have had a mission-ending electrical anomaly in December of 2021. This incident made the 6-day coherence model unfeasible, at least until the launch of Sentinel-1C, leading to a significant question: Could the existing 12-day model be adapted and improved to function as an all-encompassing synthetic NDVI generative model, bridging the gap of the two previous models? This was the starting ground to my expedition into the world of synthetic vegetation indices and to everything else this captivating field had to offer.
Generative Adversarial Networks (GANs), used to generate artificial images of synthetic vegetation index values, are often perceived as rather complex neural networks to design. A primary source of this complexity stems from the dual structure involving two intertwined networks – a generator and a discriminator – that are trained simultaneously, leading to intricate training dynamics. Achieving equilibrium between the generator and the discriminator, where neither outperforms the other, often necessitates meticulous tuning, a balance that can be challenging to achieve. GANs are also notorious among machine learning engineers for the inherent difficulties in assessing the quality and diversity of generated outputs. Such assessments are typically non-trivial, often demanding subjective or indirect measures, complicating quantitative performance evaluation. To demystify this enormous complexity for myself, I resolved to dissect the problem from three distinct perspectives: model architecture, data manipulation, and performance evaluation. The subsequent sections provide a brief recap of my explorations and some intriguing findings within these domains.
We always aim for our models to generate precise and accurate outputs and this often requires delving into complex neural networks that can learn intricate patterns beyond human comprehension. With GANs, the myriad of model architecture design possibilities presents a challenge and it’s hard to predict which designs will be effective and which might end up being counterproductive. When dealing with geospatial remote sensing data, especially in the context of agricultural parcels and making estimations about their conditions, it’s crucial for the model to produce accurate results while maintaining good spatial awareness and the ability to generate visually compelling, believable outputs. However, the task of measuring and assessing these attributes is tauntingly complex, not even mentioning the difficulty of the pursuit of solutions to attain them.
In networks that employ convolutional layers and also deconvolutions, like GANs typically do, one strategy to at least theoretically enhance spatial awareness is by enlarging the kernel sizes within those layers. Not only can this adjustment improve spatial sensitivity, but it can also mitigate the visual checkerboard artefacts commonly observed in outputs from models that utilise deconvolutional layers. It is rarely the case that a theoretically posited solution translates seamlessly into practical efficacy, yet that’s precisely what happened with the increased kernel size in this context (Fig. 1). However, seemingly straightforward solutions like this seldom come without trade-offs. Enlarging the kernel size can significantly inflate the model’s memory footprint and elongate training durations – considerations of utmost importance when resources are constrained.
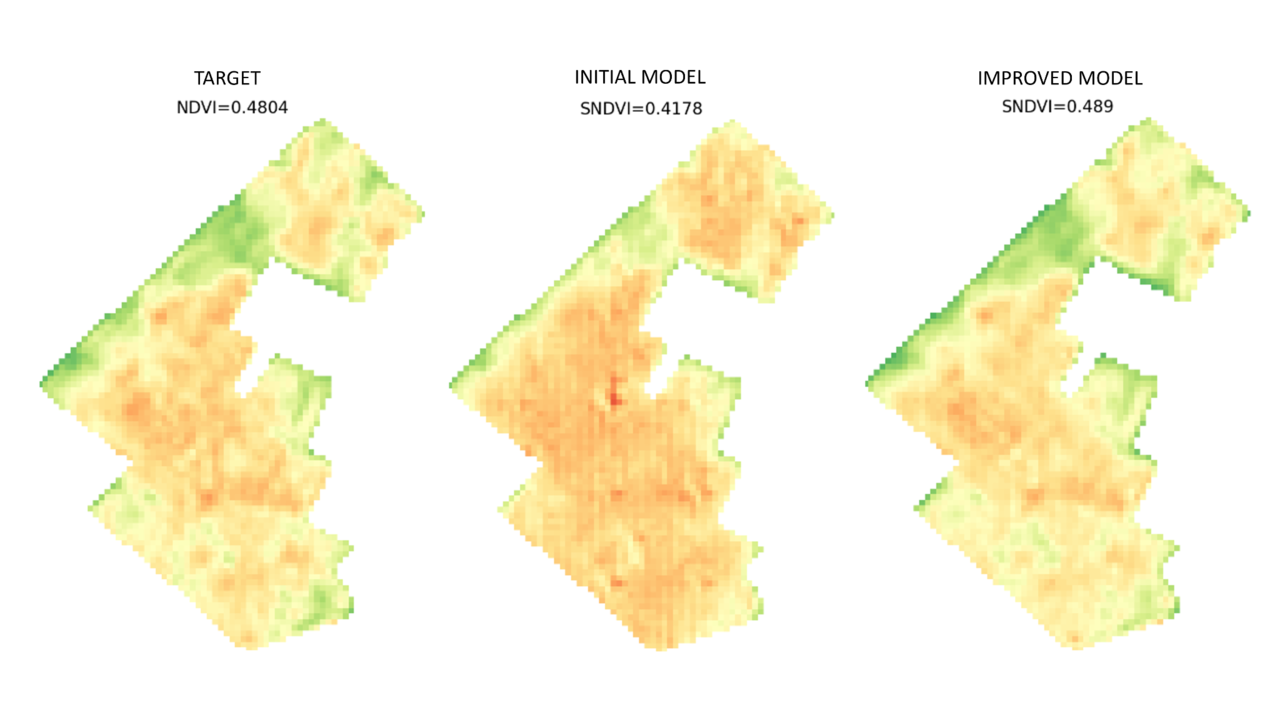
Original Image: The initial, untouched image.
Initial Model Output: Notice regular pattern distortions and lack of spatial detail.
Enhanced Model Output: Result from an improved model with adjusted kernel size and updated interpolation techniques. Notice the clearer and more spatially accurate representation.
A well-suited loss function often holds the key to achieving outstanding results and efficiently optimising a model. However, discovering the right one is seldom straightforward. In the realm of generative models, it’s beneficial to incorporate loss functions that evaluate image-specific attributes such as luminance, contrast, and structure. These attributes help in gauging the quality of the output image in relation to the actual target image. When integrated with traditional loss functions like L1 or L2, the results can potentially be further enhanced. The application of an image-centric loss function notably improved predictions of NDVI values in these experiments, registering enhancements both metrically and visually. Yet, if our primary concern revolves around the agricultural parcels – which often represent just a small fraction of the entire image – why prioritise the whole image? Integrating masking techniques within the loss function enables the model to zone in on these specific agricultural plots, sidelining extraneous areas. This approach is particularly valuable considering that changes in index values within the parcels exhibit different temporal patterns compared to their surroundings. By masking these surrounding areas, the model hones in on the parcels with greater accuracy. However, it’s a double-edged sword: while predictions for the parcels improve, those expecting a visually congruent comparison between the model’s output and the original image might be left wanting. Models trained with such a specialised loss function tend to falter when predicting areas outside of the parcels.
If there ever was a god of machine learning, it would probably declare: ‘Data is at the core of it all!’ Truly grasping the nuances of data, which can often be more complex than anticipated, is the foundation of any successful model that is built upon it. Geospatial remote sensing data brings its own set of challenges, some of which one would never even think about when working with classical tabular datasets. But after days and weeks of agony it becomes evident that these challenges can also be turned into assets. Considering satellite pass direction during the model training process is a prime example of this phenomenon. Satellites, as they orbit the Earth, can capture the same location from different directions across their various passes. Depending on whether the satellite is on an ascending or descending pass when taking an image, there can be slight variations in the angular patterns of the output. These minute differences might escape the human eye, but neural networks excel at detecting them. Remarkably, integrating information about the input image’s direction can significantly boost a model’s accuracy and computational efficiency as well. The key takeaway here is that sometimes, challenges can be cleverly repurposed into strengths.
In standard image classification problems, evaluating neural networks’ performance is usually rather straightforward with metrics like accuracy or the F1-score. However, when the focus shifts to continuous scales typical of different vegetation indices for example, evaluation nuances arise. Common metrics like Mean Absolute Error (MAE) or Root Mean Squared Error (RMSE) become essential and often satisfy the needs, but in remote sensing, there is more than just numeric accuracy to consider. Assessing the visual “goodness” and spatial integrity of the output images becomes paramount. This involves looking at the texture and smoothness of the image, its consistency with adjacent areas, its boundary delineations etc. Beyond the visual and spatial aspects, computational efficiency is a crucial aspect as well – the time taken for the model to process, its memory usage and activation patterns are all indicators of its efficiency. In essence, remote sensing brings forth multifaceted challenges that require a combination of quantitative metrics, qualitative assessments and often rather non-standard evaluation methods.
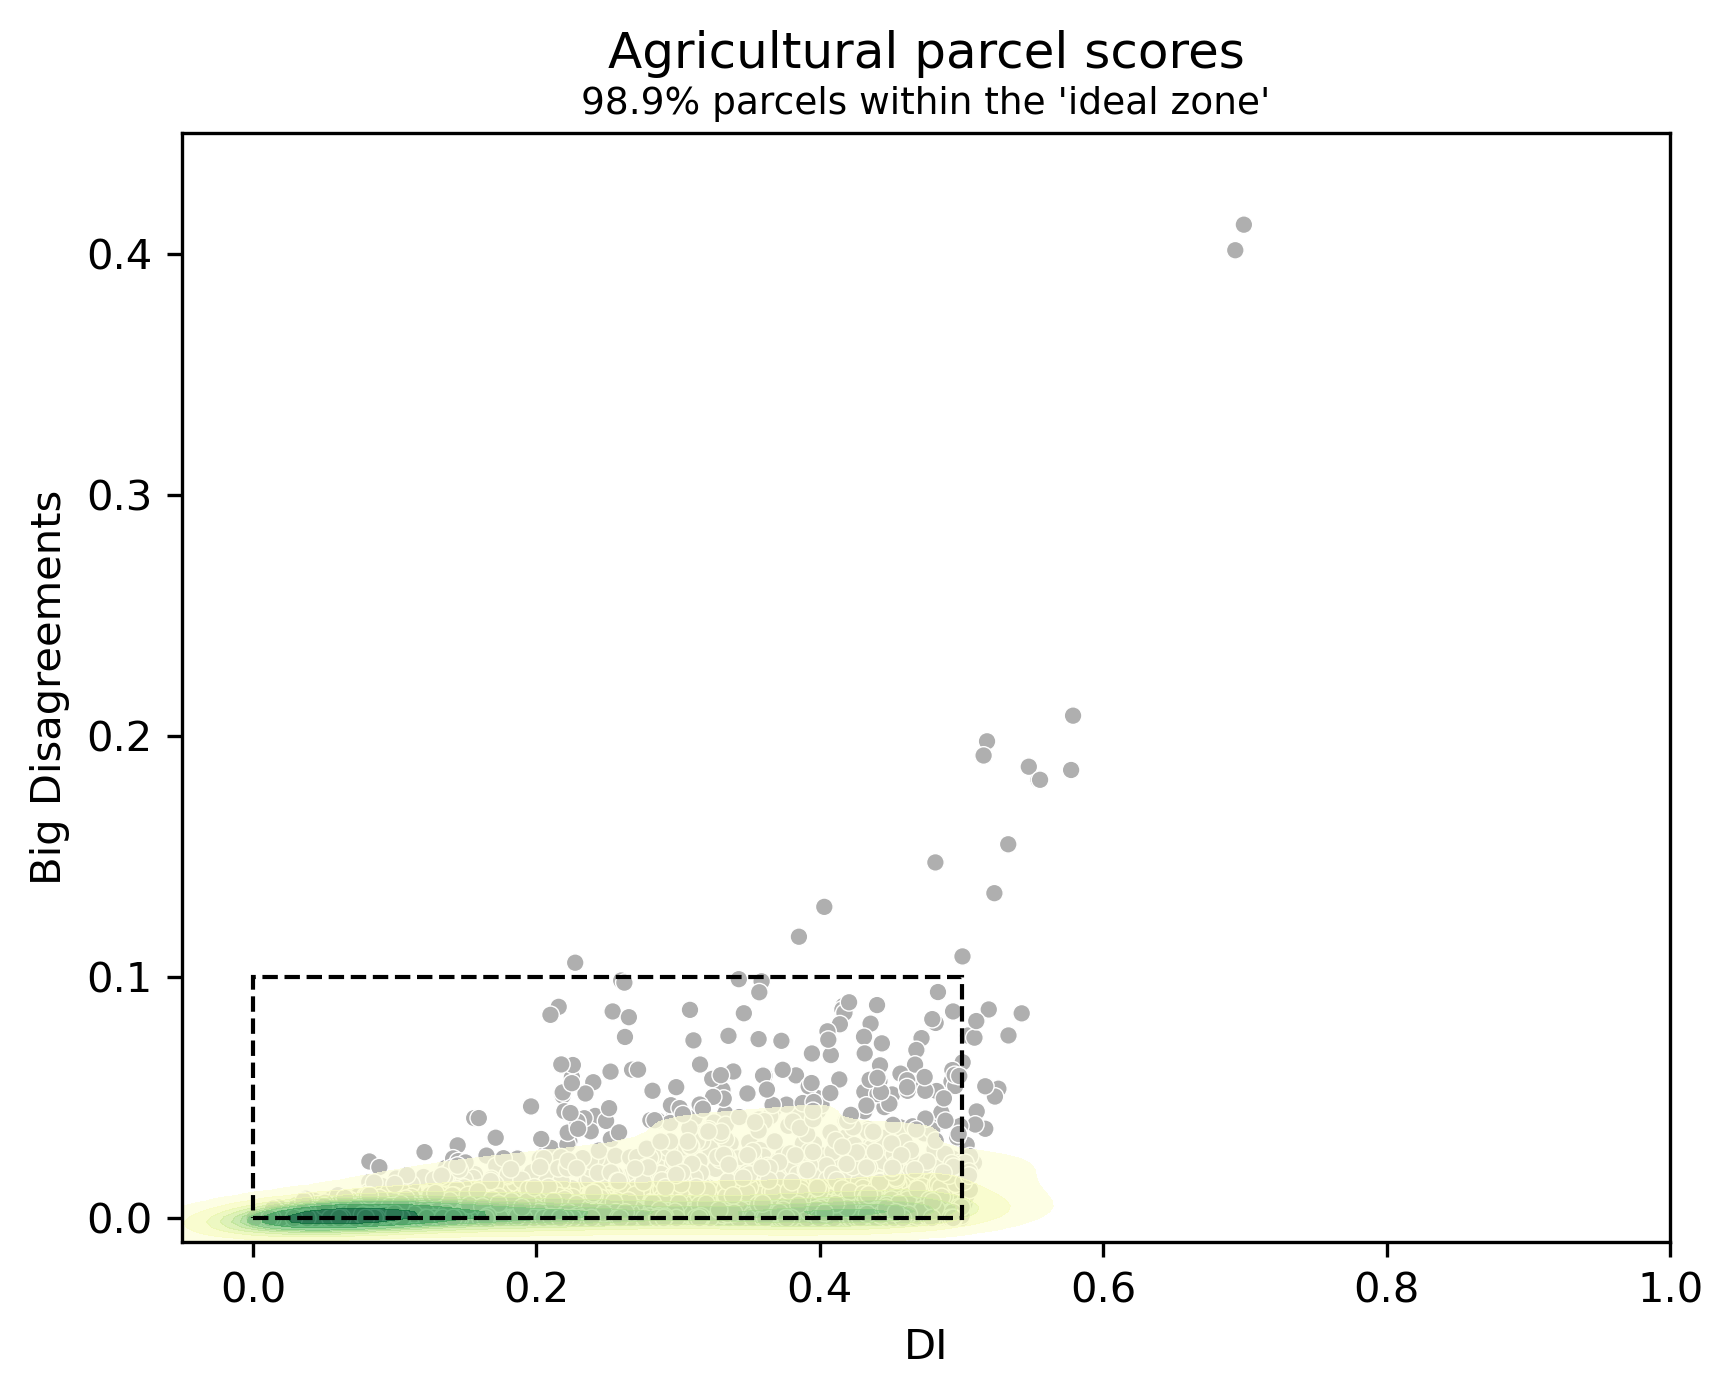
Fundamental probability theory asserts that predicting an exact value from a continuous distribution is impossible. This insight underscores the notion that while we should strive to minimise the error in predicting each pixel’s NDVI value, achieving absolute accuracy is just unattainable. Fortunately, in many contexts, exactitude isn’t even necessary. Often, synthetic NDVI serves as an alert system, signalling anomalies such as suboptimal wheat growth or a grassland not being mowed by a certain date. This leads to the idea of grouping pixels according to their index values or even further, we can look at how these values change compared to older images of the same location, much like a traffic-light system indicates status. This grouping makes it simpler to compare a model’s results with the actual image, helping differentiate between high-performing and subpar models. The objective, then, is to ensure that the class distributions in the two images align as closely as possible (Fig. 2). Furthermore, if we want to emphasise the importance of minimising significant errors, it’s beneficial to analyse the proportion of pixels with substantial disagreements between the model’s output and target image. This rather pragmatic simplification laid the groundwork for the Disagreement Index (DI), which emerged as a pivotal visual output evaluation metric in various experiments and helped to assess the model’s ability to predict the direction of change (Fig. 3). Pursuing an all-encompassing solution is often elusive, especially in the beginning stages. Thus, strategic simplifications, despite their imperfections, can pave the path toward ultimate objectives.
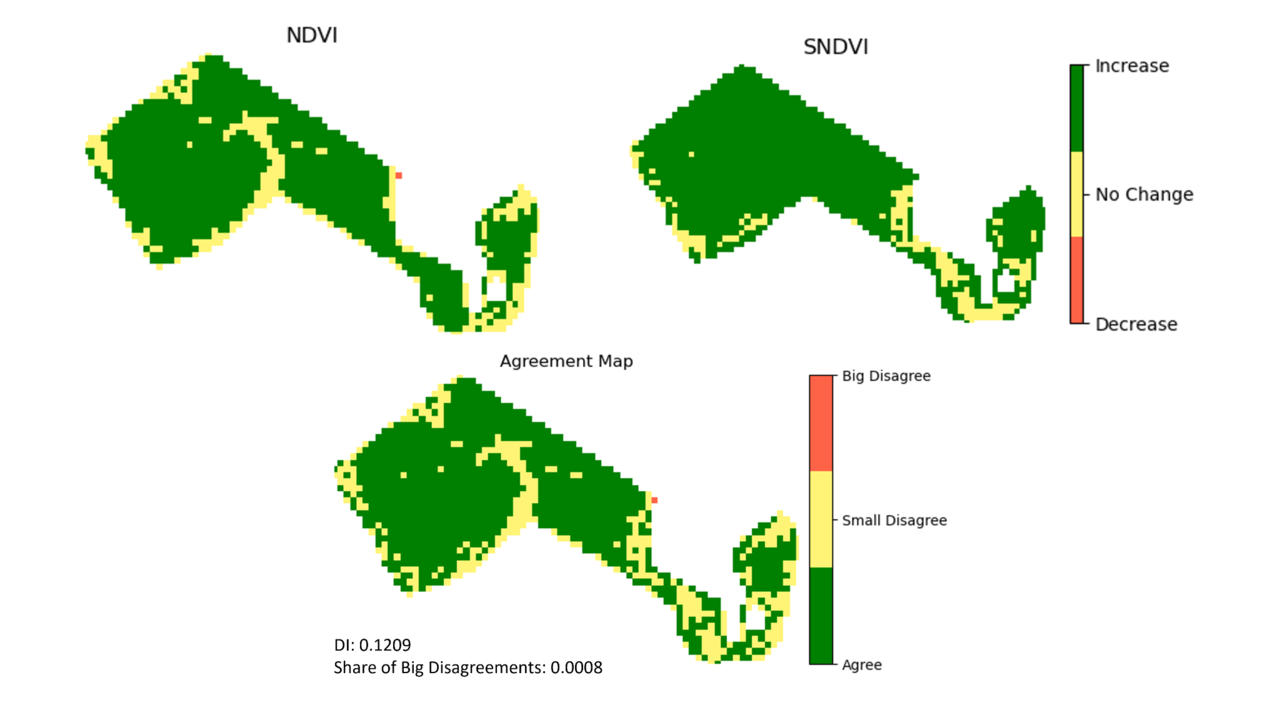
Bottom row: Agreement map between the images in the upper row.
Topics described in previous paragraphs make up just a small share of experiments carried out during my two-month stay at KappaZeta and even smaller share of all of the possible aspects to further test and develop about the synthetic NDVI models in the future. One is for certain – some talented and dedicated people are making sure that KappaZeta will be the leading provider of reliable synthetic vegetation index services in the forthcoming years!